From fragmented data to a shared view of the business.
I built the global design organization and experience strategy that transformed how Accenture's leaders used data to understand the business and make decisions.
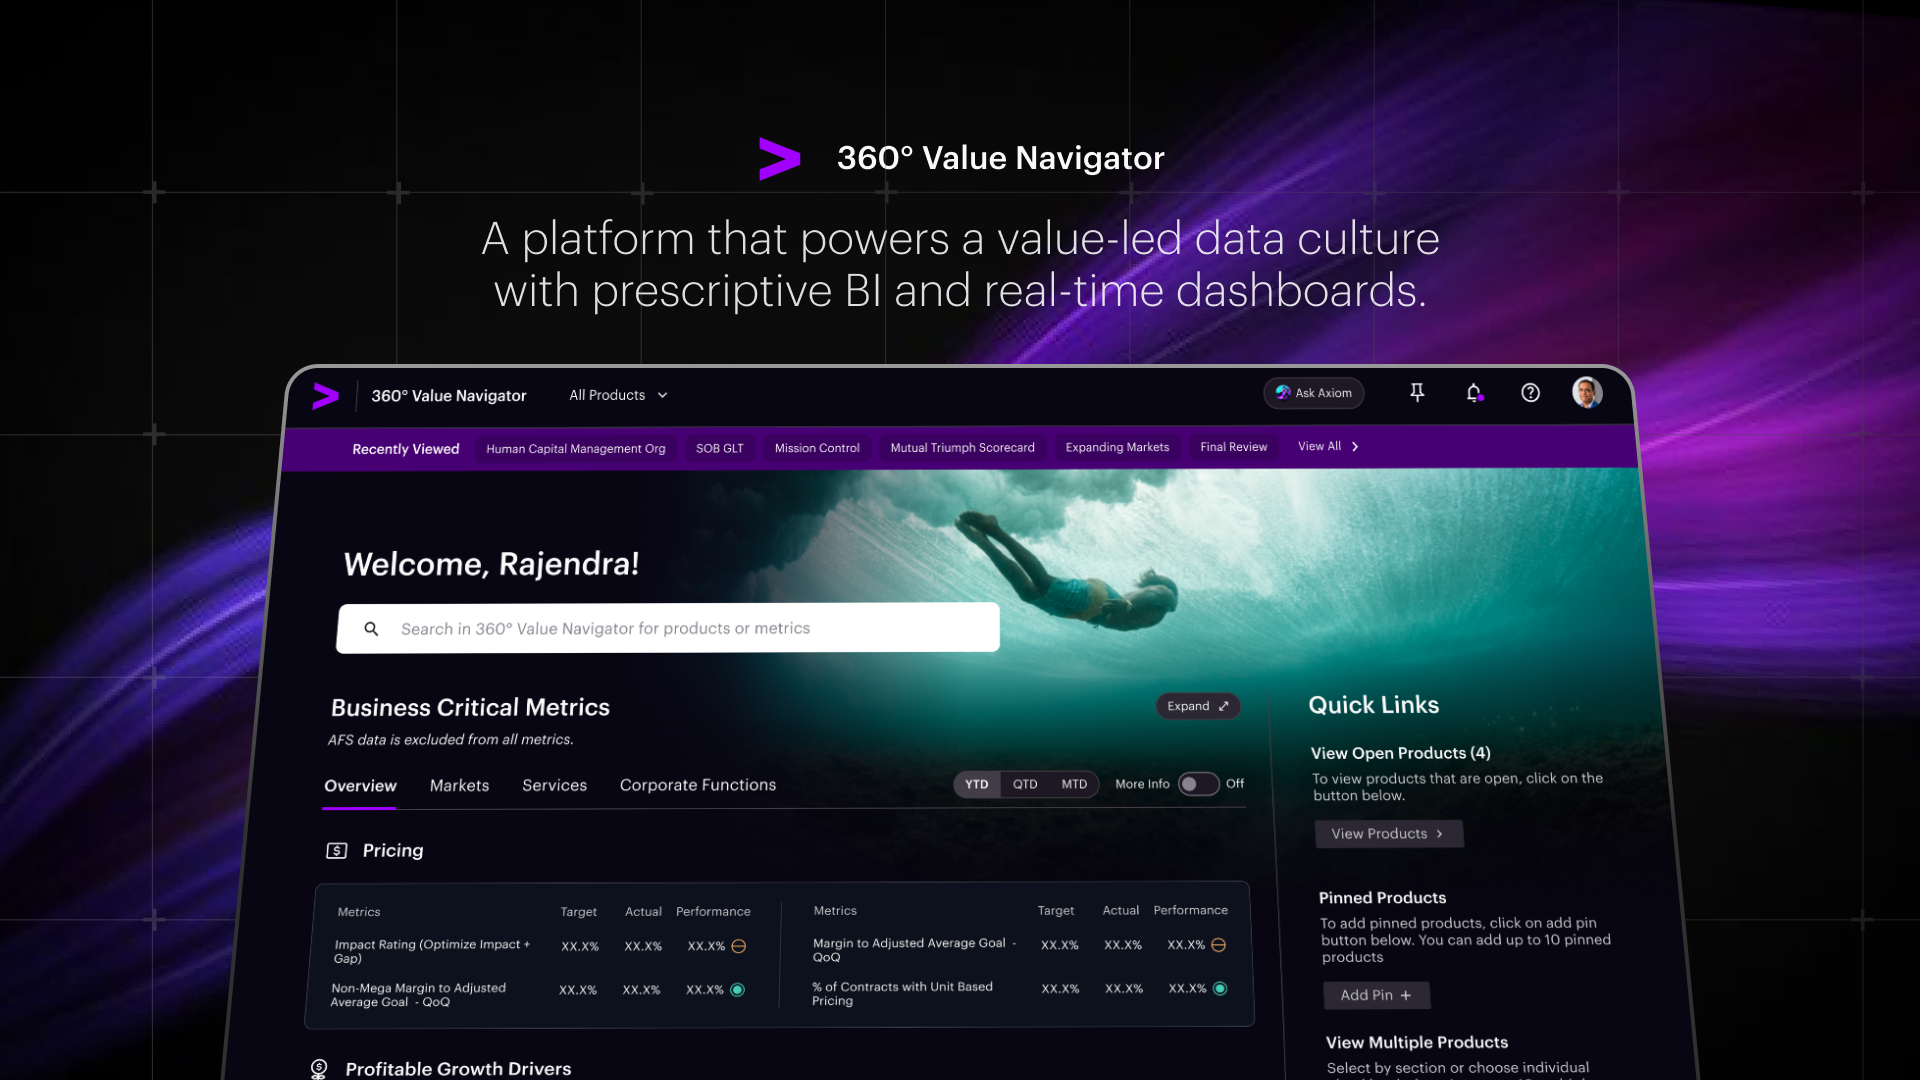
Leaders were debating the data instead of making decisions.
Existing solutions were difficult to discover, data products were not standardized, and insights remained disconnected across functions. Leaders struggled to connect the dots—slowing the speed and quality of decision-making.
How I was brought inA proof of concept for a single source of truth was gaining leadership attention, but the experience was not ready for the scale, complexity or ambition that adoption would demand.
The enterprise needed a design capability that could craft scalable experiences—and shift behaviors among data consumers and producers.
From zero to 37 in one year.
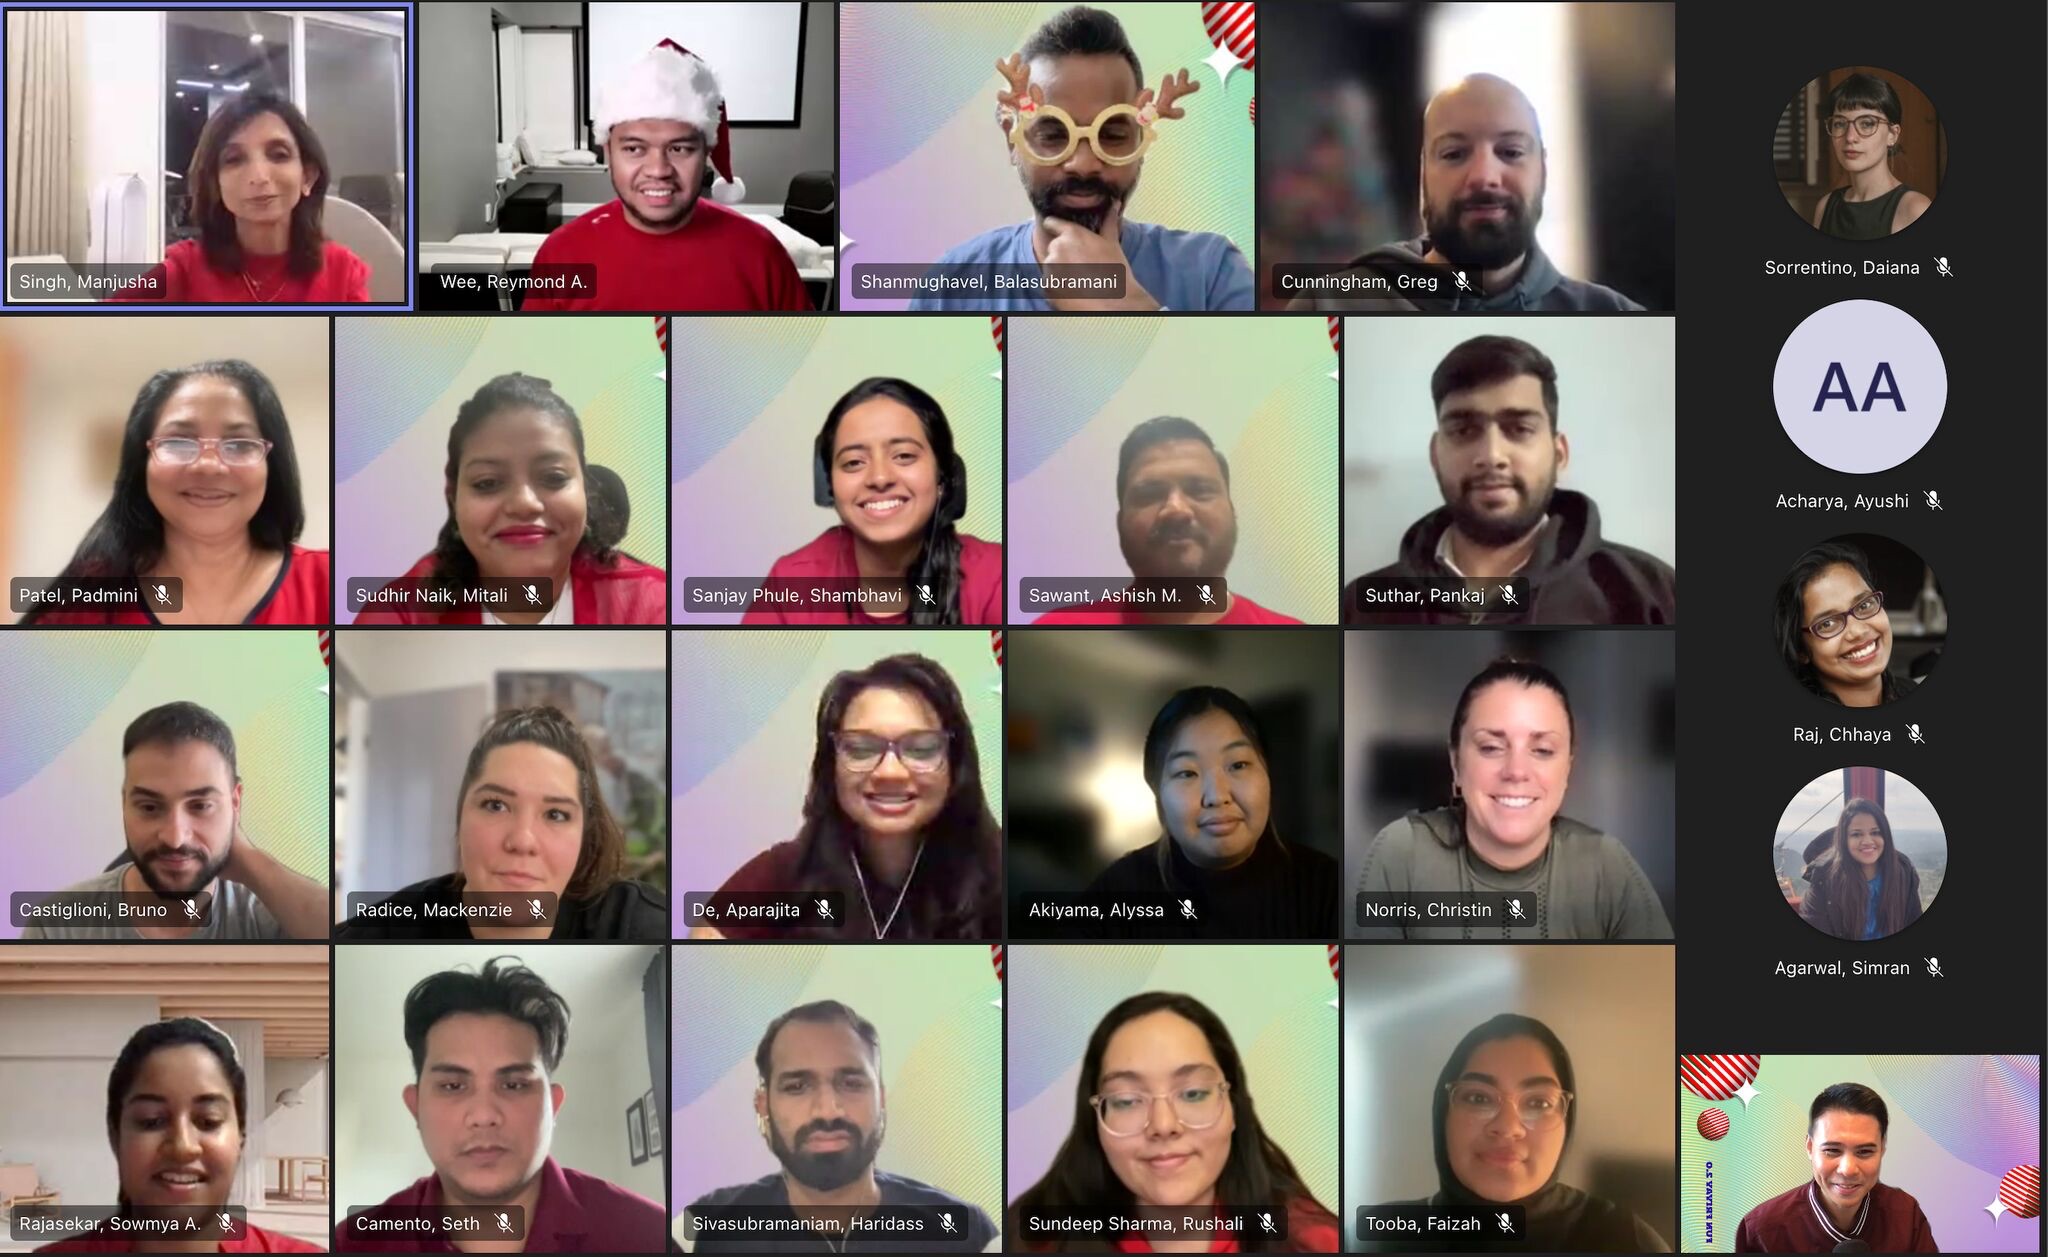
I built a multidisciplinary design organization across four geographic regions—structured around the capabilities the transformation required, not the organization that already existed.
Mapped the capability model and organization plan.
Hired and integrated design leads and designers across the US, Buenos Aires, India and Europe.
Established operational rigor by building Design Operations, team rituals and a working cadence for a globally distributed organization.
Shaped career growth and learning paths for designers.
Made key milestones and promotions visible—and worth celebrating.
Getting to the ground truth.
Research with C-suite stakeholders, market executives and functional leaders reframed the brief—from a better dashboard to a new decision-making experience.
Drove generative and evaluative research that uncovered real leadership needs and pain points.
Led cross-functional workshops to anchor the work in business objectives and technology strategy.
Framed the overarching design principles and strengthened the design brief.
Orchestrated how the multidisciplinary team would execute the experience vision.
Defined the KPIs against which the team's output would be measured.

The hardest problem was not design.
Finance, sales, HR, operations and markets each had a legitimate view of the business. The North Star shifted the conversation from competing requirements to one shared question: how should global and market leaders understand and run the business?
Made the design prototype the center of attention—shifting conversations from “show” to “tell.”
Communicated research-based insights and the resulting design principles clearly.
Listened to differing viewpoints, acknowledged them and incorporated the strongest ideas.
Kept stakeholders current on key design changes and the rationale behind them.
Used testing and feedback to justify design direction with data.
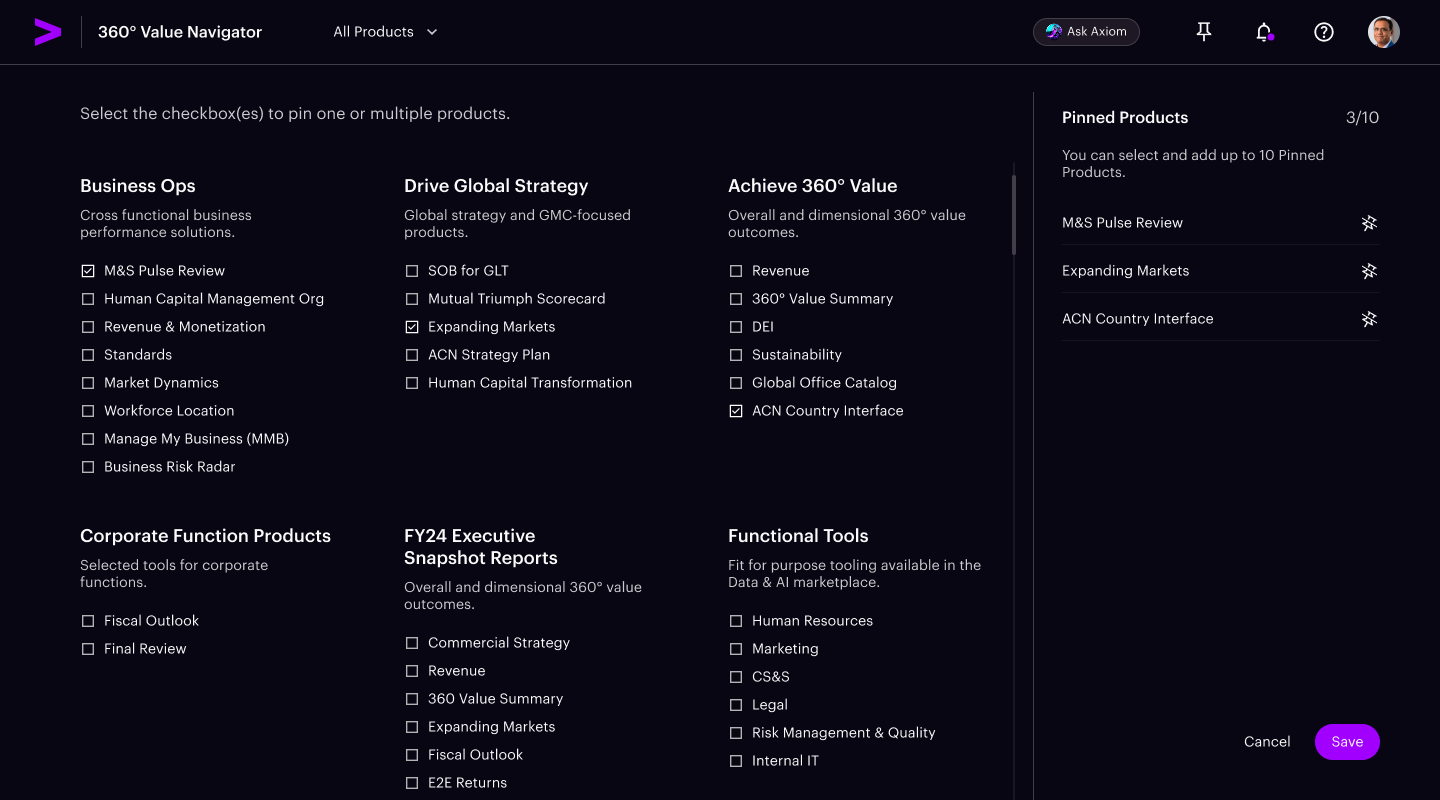
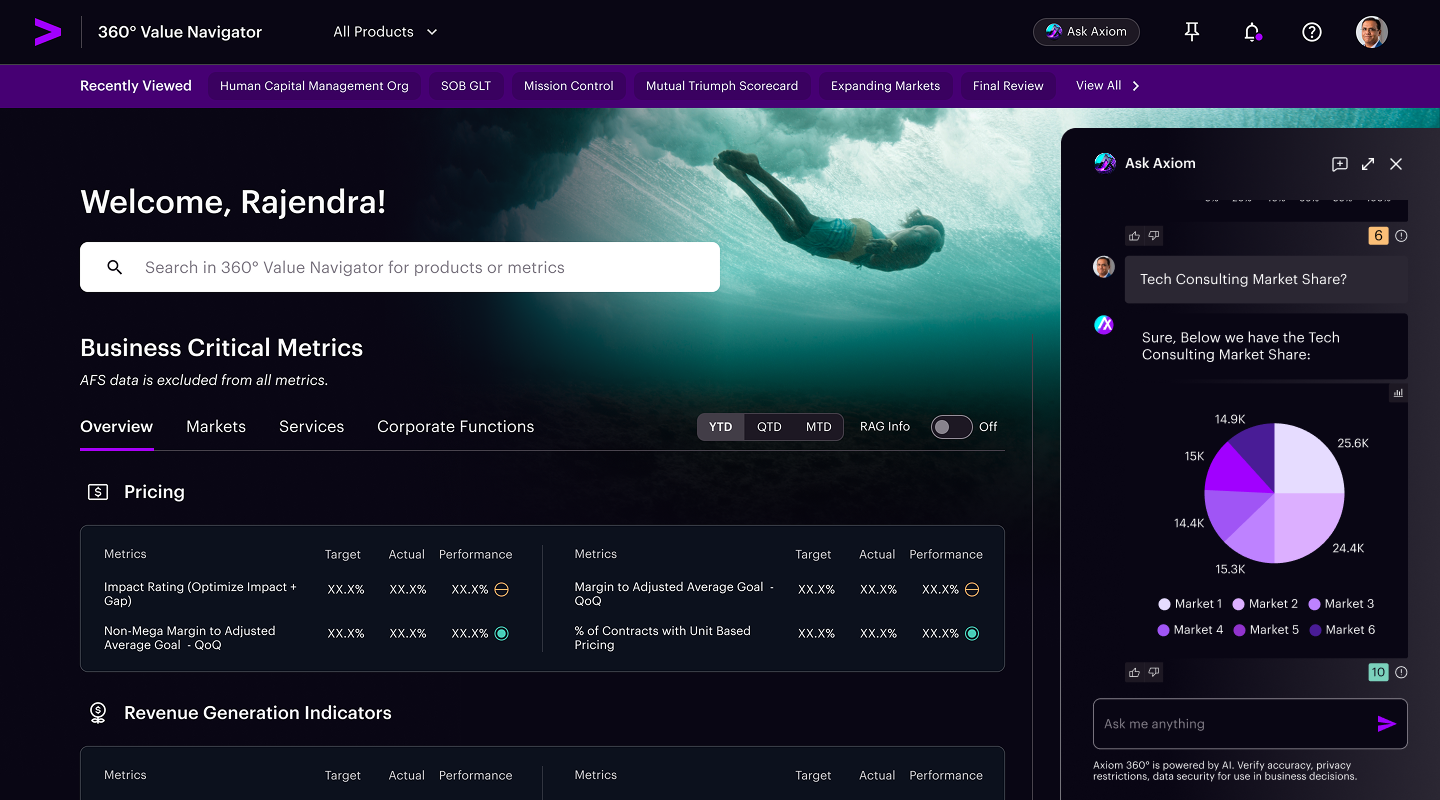
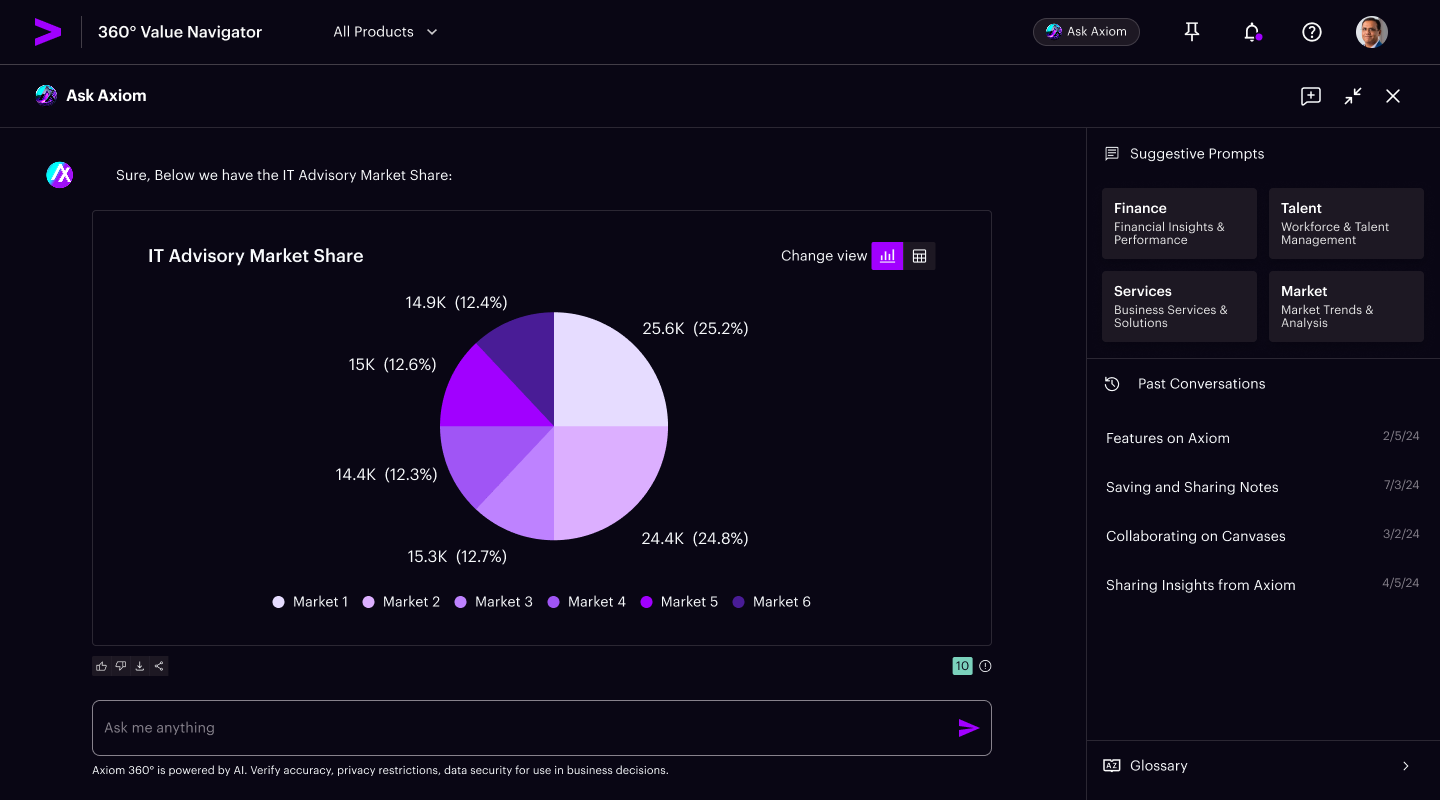
I drove the creation of a design system that allowed our work to scale with speed.
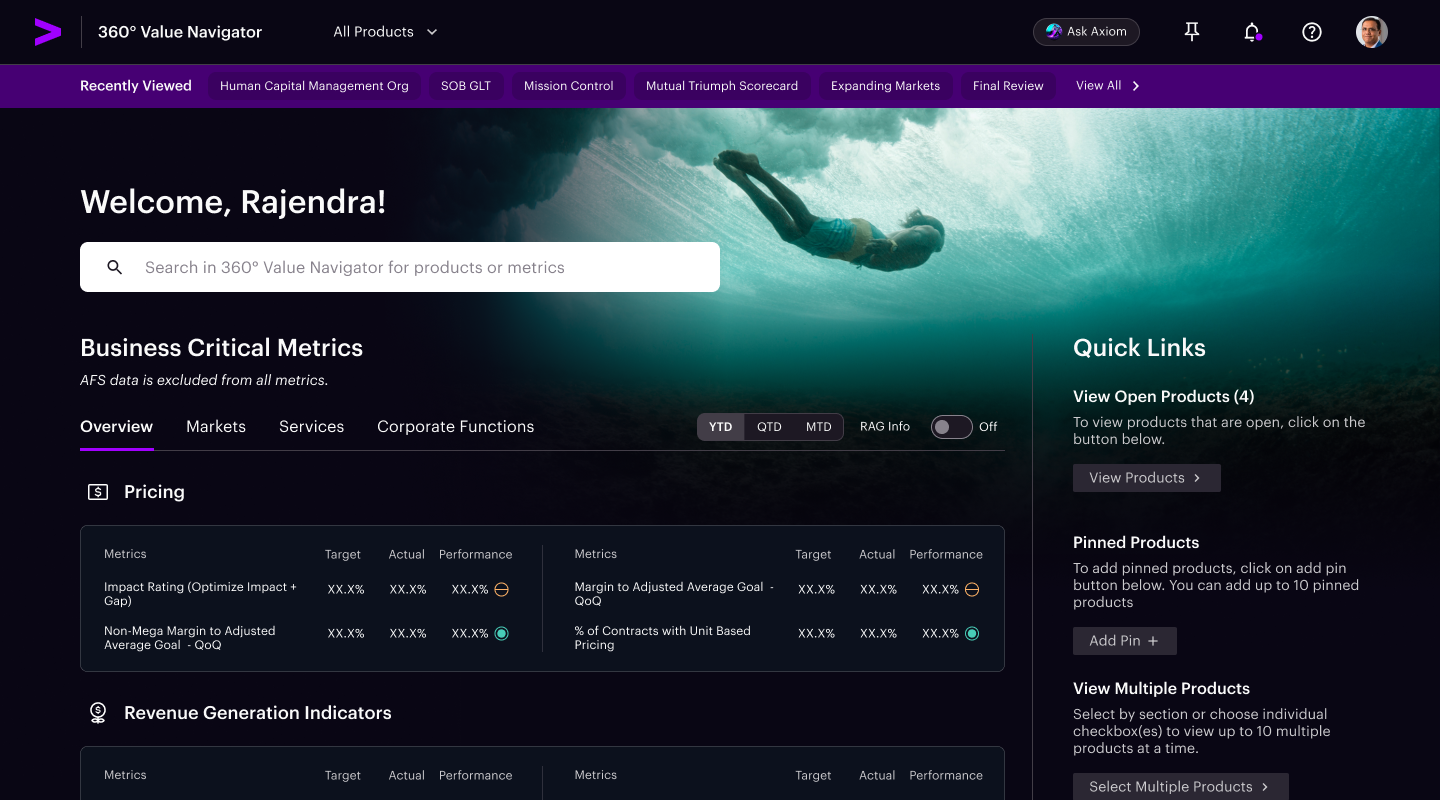
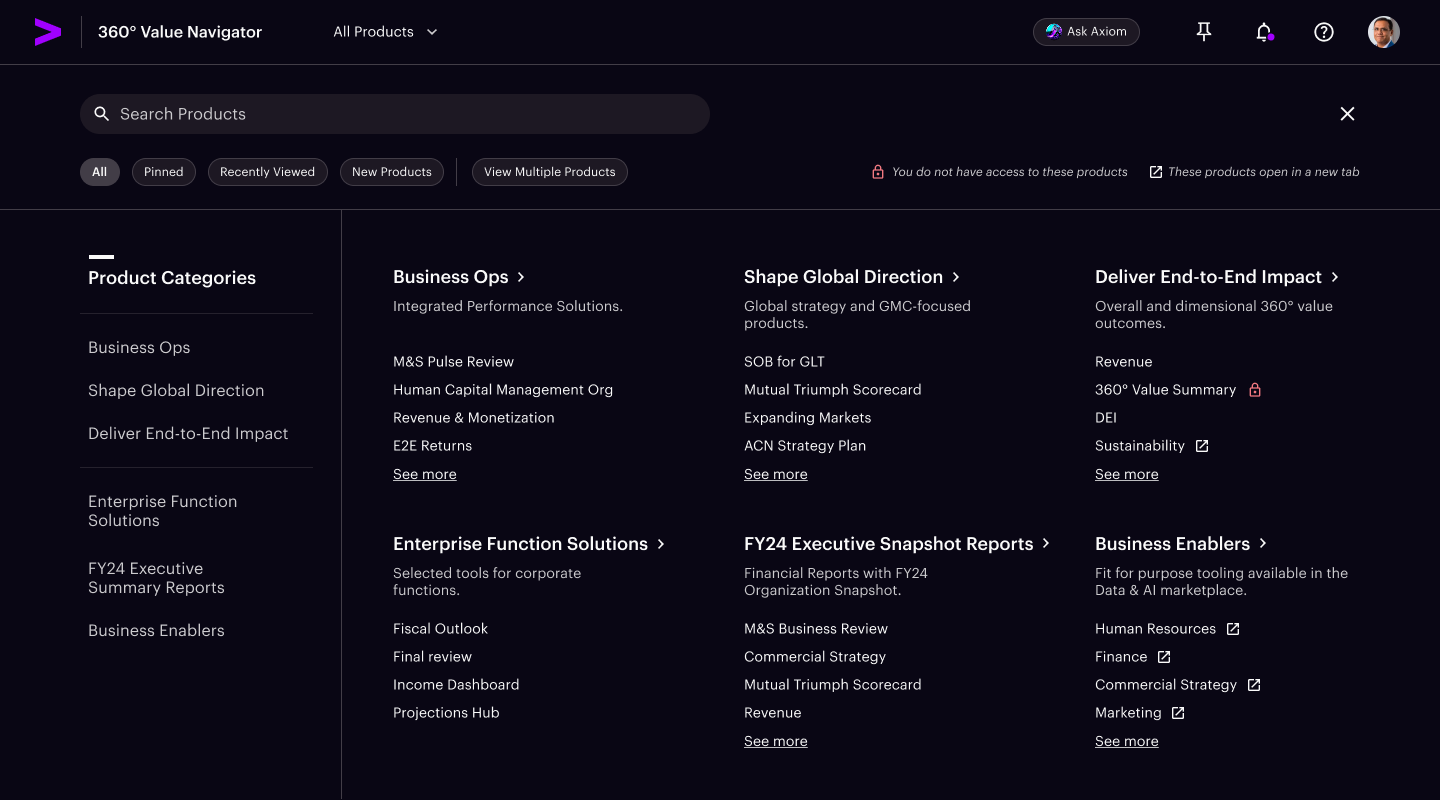
Then the CEO used it—and loved it.
The CEO used the platform herself and told the team it gave her what she needed to understand the business, shape conversations and make decisions.
She asked Accenture's leaders to use it as the de facto platform for data and insights.
Used in monthly operating reviews.
Used in state-of-the-business discussions.
A shared destination for leadership insights.
Packaged as an offering for Fortune 500 organizations.
The organization was the enduring design.
The outcome I'm proudest of was building a team, vision and foundation capable of continuing to deliver after I was gone.
Create a shared direction.
Alignment did not require sameness. It required a vision that every function could see itself in.
Make strategy tangible.
The North Star gave business and technology leaders something concrete around which to make decisions.
Scale through systems.
The team, operating model and experience architecture allowed quality to grow beyond any one person.